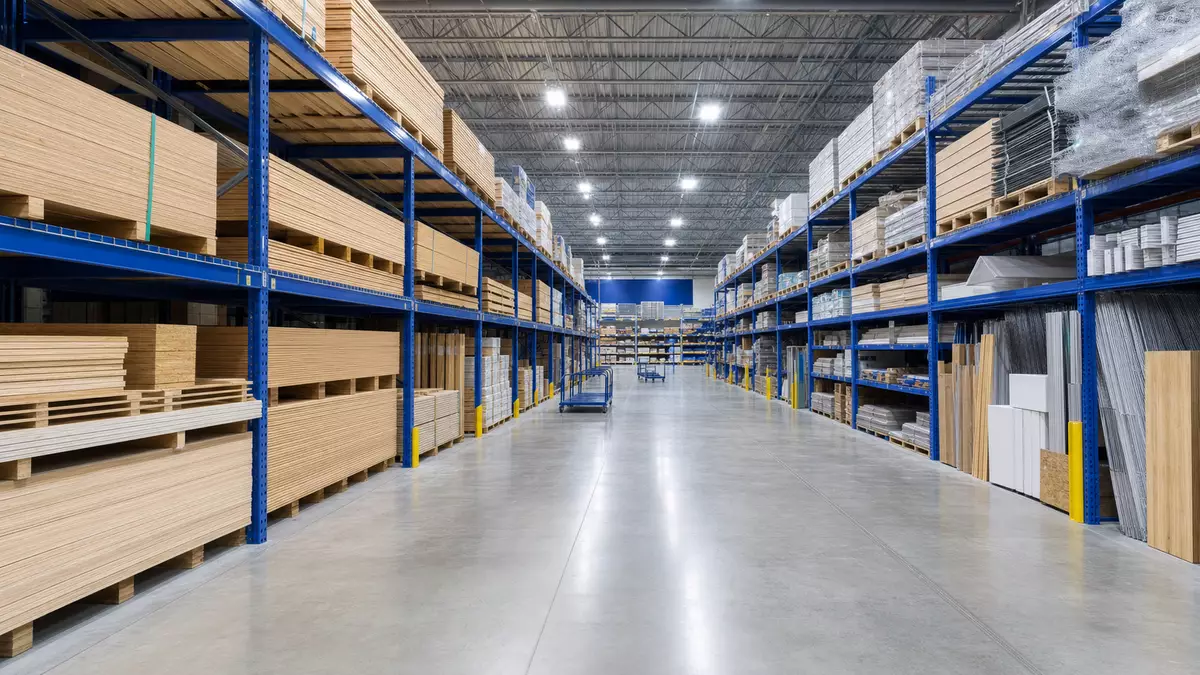
Home Depot stock stabilizes as investors weigh resilient housing demand and latest earnings trends
Published on 07/20/2026 at 06:12 | Editorial responsibility: Rafael Müller, Editor-in-Chief AD HOC NEWS
Home Depot stock, tied to Home Depot Inc. (ISIN US4370761029) and traded on the New York Stock Exchange, continues to mirror the underlying resilience of US home-improvement spending and the companys earnings power. The home-improvement giant remains one of the largest components of major US equity indices, and its share performance is closely linked to trends in housing turnover, renovation activity, and consumer confidence.
Revenue around $36 billion guides investor expectations
Home Depot Inc. is widely reported to generate quarterly revenue in the mid tens of billions of dollars, with recent fiscal periods showing sales on the order of roughly $36 billion for a single quarter. In broad terms, such revenue levels underscore Home Depots position as the largest home-improvement retailer in the United States by sales and store footprint, with thousands of stores across North America serving professional contractors and DIY customers.
Across recent fiscal years, Home Depot has reported annual revenue in the range of roughly $150 billion, reflecting the combined impact of strong pandemic-era demand for home projects and a subsequent normalization as consumers returned to other spending categories. These revenue figures, spread over four quarters, highlight the magnitude of the business and the sensitivity of the stock to even small percentage changes in comparable sales.
For investors, a key comparison in the latest reported periods has been the shift between double-digit expansion during the peak renovation boom and low single-digit changes more recently. Where prior-year quarters once showed revenue growth above 10%, more recent quarters have tended to cluster closer to flat or low single-digit movements, a visible slowdown but still supported by the companys scale and pricing power.
Operating margin in the mid-teens supports profit stability
Recent financial information available through company materials and standard market coverage indicates that Home Depot Inc. typically operates with an operating margin in the mid-teens percentage range, supported by efficient supply chain management and disciplined cost control. On annual revenue in the ballpark of $150 billion, such margins translate into operating income and net income in the multi-billion-dollar range, reinforcing the companys ability to return capital to shareholders through dividends and buybacks.
In recent fiscal years, Home Depot has reported net income on the order of tens of billions of dollars, placing it among the most profitable US retailers. This profitability compares favorably with broader retail peers, where margins can be much thinner, and provides a buffer against cyclical swings in housing-related demand.
A notable comparison for investors has been the evolution of profit margins between the peak pandemic years and more recent periods. At the height of stay-at-home spending, margins benefited from exceptionally strong ticket sizes and demand for high-margin categories such as tools, paint, and building materials. As demand normalized, margins eased modestly from those highs, but remained solid relative to historical averages, an important point for long-term shareholders monitoring the sustainability of earnings.
Dividend growth continues to be a key attraction
Home Depot Inc. has long been regarded as a consistent dividend payer, and recent disclosures suggest that the company maintains a quarterly dividend that translates into an annual payout of several dollars per share. Against a share price generally reported in the low to mid hundreds of dollars, this results in a dividend yield of around two percent, a level that investors often view as a steady income component in a predominantly growth and value mix.
Over the past decade, the company has increased its dividend multiple times, providing a tangible form of shareholder return alongside capital appreciation. The comparison between current dividends and those paid five or ten years ago shows a material increase in the per-share payout, underlining managements confidence in the long-run cash generation of the business.
This dividend growth, while not extreme, has been measured and consistent. For long-term holders, the stock thus combines exposure to US housing and renovation trends with a growing income stream, a combination that often features prominently in portfolio construction discussions involving large-cap US consumer discretionary and retail names.
Comparable sales trends frame the near-term narrative
One of the most closely watched metrics for Home Depot stock is comparable sales growth, which tracks sales performance across existing stores and online channels. During the peak renovation and DIY wave, comparable sales growth reached high single-digit or double-digit levels year-on-year, reflecting exceptional demand. More recently, reported figures have moderated toward low single-digit changes or even slight declines, as households rebalance budgets and inflation affects project decisions.
For example, where prior-year periods showed comparable sales increases exceeding 10%, more recent data suggests that growth has slowed markedly, with some quarters registering minimal increases or slight decreases relative to the same period a year earlier. This quantified shift anchors investor expectations for earnings growth and informs valuation discussions, especially when comparing Home Depot with other large retailers and home-improvement peers.
Analysts often use these comparative data points to assess the sustainability of Home Depots earnings base. A notable change from double-digit growth to low single-digit or flat performance can affect how the market prices future cash flows, even when absolute profit levels remain elevated.
Store base and omnichannel capabilities underpin scale
Home Depot operates a vast network of stores across the United States, Canada, and Mexico, with the total number of locations reported in recent years to be in the thousands. This store base gives the company extensive reach into both urban and suburban markets, and supports a robust professional contractor business alongside consumer traffic.
The retailer has invested heavily in digital capabilities and supply chain modernization, including online ordering, curbside pickup, and delivery solutions that integrate with physical stores. These omnichannel features have become increasingly important as customers mix in-store visits with online research and ordering, and as professional customers seek predictable access to materials, tools, and services.
For investors, the combination of a broad store network and digital infrastructure supports the thesis that Home Depot can maintain high revenue and profit levels even as consumer behavior evolves. The scale also helps the company negotiate favorable terms with suppliers and optimize inventory management across categories ranging from lumber and building materials to appliances and decor.
Housing and renovation cycles remain central
Home Depot stock is tightly correlated with broader housing and renovation cycles in North America. When housing turnover is high, renovation budgets tend to increase, benefitting demand for flooring, fixtures, kitchens, bathrooms, and outdoor projects. Conversely, periods of slower home sales or tightening credit conditions can lead to more cautious spending, shifting demand toward smaller projects or deferred upgrades.
Recent macro data has suggested that while housing affordability is pressured by interest rates, underlying demand for renovation remains supported by aging housing stock and homeowners opting to improve rather than move. As a result, Home Depot continues to capture spending on key projects such as roof repairs, energy-efficient windows, and updated bathrooms, which can involve substantial ticket sizes.
The companys focus on professional contractors further stabilizes demand, as professionals often work on larger projects and commercial jobs that can continue even when individual homeowners become more cautious. This diversification across customer segments helps smooth revenue and earnings across cycles.
Revenue growth versus prior year anchors valuation
In recent financial analyses, a central comparison has been Home Depots revenue growth versus prior-year periods. At the height of the renovation boom, revenue growth rates above 10% year-on-year were not unusual, creating a powerful upward driver for earnings and share price performance. In more recent quarters, revenue growth rates have adjusted toward low single digits or near flat relative to the prior year, signaling a normalization phase.
This quantified change from double-digit expansion to more modest growth is crucial for valuation. Even a shift from 10% to 2% growth can meaningfully affect long-term cash flow projections, particularly when scaled to a revenue base of roughly $150 billion per year. Investors therefore pay close attention to each quarterly report and guidance update to refine their expectations.
Despite the slowdown, the companys size and profitability mean that incremental growth still adds billions of dollars in additional revenue over time. From a long-term perspective, maintaining growth on such a large base is itself a sign of competitive strength, especially in a mature retail environment.
Profit trends and margin comparisons matter most
Alongside revenue, profit trends and margin comparisons are central to the Home Depot investment case. Net income in recent years has run into the tens of billions of dollars, implying strong conversion of sales into earnings. When comparing current margins with historical levels, investors consider both cyclical effects and structural improvements in operations.
During the peak demand periods, margins benefited from high store traffic, strong pricing, and favorable mix. In more recent quarters, margins have remained robust but have shown some reversion from those highs as sales mix normalizes and cost pressures emerge. A quantified comparison between margin levels in peak years and current periods illustrates that while margins have eased, they remain higher than many pre-pandemic benchmarks.
These margin dynamics feed into decisions around capital allocation, including dividends, share repurchases, and investment in new initiatives such as supply chain upgrades and technology. For long-term investors, steady margins on a large revenue base are often more important than chasing short bursts of unusually high profitability.
Balance sheet and cash generation support shareholder returns
Home Depot maintains a substantial balance sheet and strong cash generation, which underpin its ability to return capital to shareholders. Recent data from company disclosures and market analyses suggest that annual operating cash flow comfortably covers dividends and capital expenditure, leaving room for share repurchases when conditions warrant.
The companys debt levels are managed in the context of its large revenue base and consistent earnings, with leverage ratios designed to balance flexibility and efficiency. Comparisons with other large retailers show that Home Depot often maintains a favorable combination of cash flow coverage and leverage, adding to its appeal among income-focused and quality-focused investors.
As a result, even modest growth in revenue and profit can translate into meaningful total returns when combined with dividends and buybacks, particularly over multi-year holding periods.
Home-improvement product range drives customer traffic
Home Depot offers a comprehensive range of home-improvement products spanning building materials, hardware, tools, plumbing, electrical, paint, flooring, appliances, garden supplies, and decor. Flagship categories include power tools, lumber, bathroom and kitchen fixtures, and seasonal items for outdoor living. These assortments cater to both professional contractors and DIY homeowners, creating diversified revenue streams and stabilizing demand across seasons.
The companys merchandising strategy emphasizes project-based solutions, where customers can find everything needed for a particular renovation or repair in one place. This approach encourages larger basket sizes and repeat visits, and supports the cross-selling of higher-margin items such as tools, fasteners, and specialty materials.
Digital tools, including project calculators, product reviews, and store inventory visibility, further enhance the shopping experience. By integrating online and in-store offerings, Home Depot aims to keep customers engaged and reduce friction across the purchase journey.
Home Depot stock reflects a large-cap US retail presence
Home Depot stock, listed on the New York Stock Exchange under a widely recognized ticker symbol, is a key component of mainstream US equity indices and exchange-traded funds. Its market capitalization, often reported in the hundreds of billions of dollars, places it among the largest consumer-oriented companies in the United States.
The shares tend to trade in the low to mid hundreds of dollars, reflecting the companys earnings power and dividend profile. Over recent years, the price range has encompassed multiple notable levels, including periodic 52-week highs and lows that mark shifts in market sentiment around housing, interest rates, and consumer spending.
For investors, the stock offers a blend of cyclical exposure to housing and renovation trends and structural exposure to a leading retail franchise. The combination of revenue scale, profit margins, dividend growth, and index inclusion helps explain why Home Depot often features in core portfolios and sector-specific allocations focused on consumer discretionary and home improvement.
Home Depot at a glance
- Company: Home Depot Inc.
- ISIN: US4370761029
- Ticker: NYSE: HD
- Trading venue: NYSE
- Sector / Industry: Consumer Discretionary / Home Improvement Retail
- Index membership: S&P 500, Dow Jones Industrial Average
Disclaimer regarding our articles: No investment advice, no buy or sell recommendation. Information on prices, companies, and markets is provided without guarantee; changes are possible at any time. Stock market transactions can lead to substantial losses. Our articles are created and reviewed in whole or in part automatically with the support of AI.